Portfolio S-curve — planned, earned and actual cost
Cumulative since September 2024, USD millions. Shaded band = selected period.
Planned value (PV)Earned value (EV)Actual cost (AC)
What this board answers
The three questions the PMO gets asked every month
Site network — where the portfolio sits and where the waste goes
Marker size = budget at completion; colour = cost health in the selected period. Arcs show the disposal path into Clive, UT.
On budget (CPI ≥ 0.97)Watch (0.92–0.97)At risk (< 0.92)ES facility / office
Project ranking — variance at completion
EAC vs BAC, USD millions. CPI and SPI for the selected period.
Report estate — the monthly pack and its refresh health
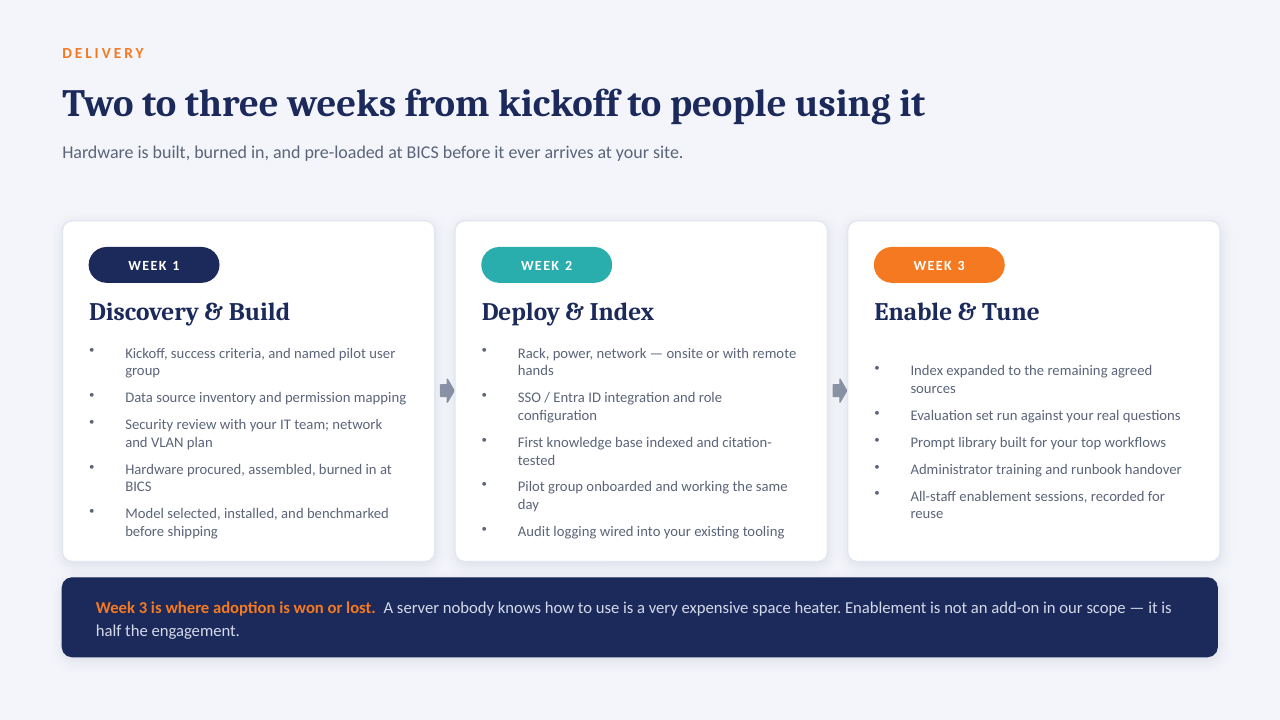
The reports the PMO owns, what feeds them, and whether they landed on time in the selected period. Source shows the Excel → data-lake transition.